
Who’s cooking Thanksgiving dinner for you tomorrow?
Specifically, I want to know if your family is doing the cooking – or if you’re outsourcing the meal prep to a robot.
If it sounds like a silly question, well, let’s frame it with respect to our usual beat – generating safe 7% and 8% yields in your retirement portfolio. Would you blindly buy and sell dividend payers based on the “insights” of a computer?
I often hear from readers who catch a “robo rating” on one of our holdings and worry. Even when the analysis is mere inches deep, like this one:
(Your stock) appears to be not be meeting its earnings expectations for past 6 quarters, the profitability of the company is poor which affects its valuation, and its ability to maintain its dividend.
As a computer guy myself, I’m offended – this is insulting to software and humans alike. This paragraph is masquerading as analysis when it is merely:
- Looking in the rearview mirror,
- Using data that everyone else has, and
- Applying it incorrectly to boot (with regards to the dividend sustainability).
I’ll explain three common robot mistakes in a minute, so that you can be aware of them when you see them (which you will as machines continue to take over finance, to the detriment of those who trust them blindly). First, let’s recap our contrarian strategy for finding yields that are meaningful and secure.
We’ll Take the Stairs
Renowned value investor Howard Marks, chief of Oaktree Capital Group (OAK) with $100 billion under management, attributes his great success to “second-level thinking.” That’s two flights up from the robots.
For example, a typical “first-level thinker” will buy a cheap stock. A headline-driven income investor will buy a 5% yield. They’re buying and selling on headlines, looking at the same data. They have no edge, which means their returns will be average (at best).
Marks makes his fortune upstairs with “second-level thinking.” He explains:
- “First-level thinking says, ‘It’s a good company let’s buy the stock.’ Second-level thinking says, ‘It’s a good company, but everyone thinks it’s a great company, and it’s not. So the stock’s overrated and overpriced; let’s sell.’”
- “First-level thinking says, ‘The outlook calls for low growth and rising inflation. Let’s dump our stocks.’ Second-level thinking says, ‘The outlook stinks, but everyone else is selling in panic. Buy!’”
- “First-level thinking says, ‘I think the company’s earnings will fall; sell.’ Second-level thinking says, ‘I think the company’s earnings will fall less than people expect, and the pleasant surprise will lift the stock; buy.’”
When investors accept higher risk in hopes of higher return, their entire thinking is flawed, according to Marks. He explains: “If riskier investments could be counted on to return more – they wouldn’t be riskier!”
Instead, he believes “investments that appear riskier have to appear to offer higher returns, or nobody will make (invest in) them. But that doesn’t mean it has to come true.”
We’ve used this insight to our advantage with our Contrarian Income Report holdings. We buy big yields when they appear risky (to the headline followers who are missing some key underlying insight). The result is, ironically, less downside and higher upside for us.
First-Level Analysis Has a Basement
Robots are taking over the investing world because, on average, they’re a bit better than the average investor. By taking emotions away and buying and selling systematically on widely available data, they can outperform the fear-and-greed crowd.
But in our world, the corners of the income universe where data isn’t as widely available, they are a bit worse than the average investor. Let’s talk about some common mistakes robots make when grading 6%+ yields.
Robot Mistake #1: Confusing the Key Profit Metric
Machines are accustomed to looking for earnings-per-share (EPS) as the key measure of profit. For your average stock, this is a fair proxy. For our average stock, it is not.
Real estate investment trusts (REITs), for example, generally report funds from operations (FFO) as the cash available to dish out as dividends. Others, such as Omega Healthcare Industries (OHI), use funds available for distribution (FAD) as their key metric (a variation on FFO).
This lack of consistency makes it impossible for any computer program to track. It’s an advantage for us human thinkers, who can look at each company individually and compare accordingly.
Robot Mistake #2: Mistaking Success for Future Failure
Closed-end funds (CEFs) are challenging for people and robots alike because of their key (and counterintuitive) metric – net investment income, or NII.
CEFs exist to pay dividends. Many pay 6%, 7% or 8% or more. And they tend to be black boxes, reporting only a few metrics (such as NII) on a regular basis.
On the surface, it makes sense to look at NII and check that it covers the dividend. In reality, that’s all wrong.
NII often plummets when a fund rakes in capital gains. For example, let’s consider the recent case of PIMCO’s Dynamic Credit and Mortgage Fund (PCI) – a target of robots and humans that think like robots of late.
My CEF-expert colleague Michael Foster recently helped explain the nuance to my readers:
Throughout 2017, PCI has seen its net asset value (NAV) rise considerably thanks to capital gains in its portfolio. Simply put, the bonds PCI owns are exploding in value. They are handily outpacing other high yield bonds:
PCI’s NAV (Blue) Laps its Benchmark (Orange)
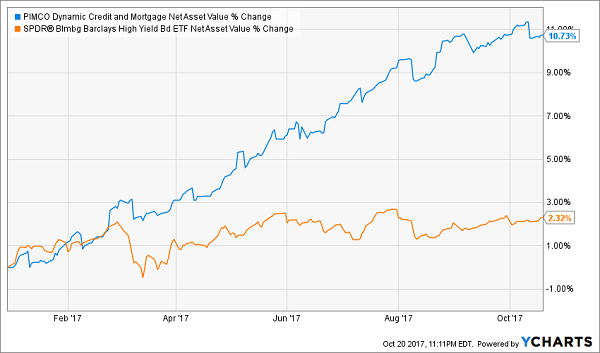
Many investors don’t realize that PCI’s NII decline is the result of its NAV growth. Simply put, when bond values go up, their yields go down, and the capital gains in PCI mean that its income stream is lower.
But the value of the fund is rising after a steep decline in late 2014 and through early 2016:
The Bull Run in PCI’s Bonds
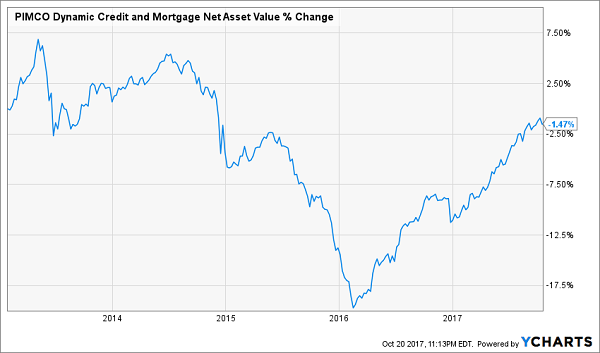
Since PCI can (and does) fund distributions from NAV gains, the regular dividend is safe.
Again, there’s no easy way for a computer to track all of those wheels in motion. We humans remain superior.
Robot Mistake #3: Looking in the Rear-View Mirror
Finally, a computer’s “buy, hold or sell” output is only going to be as good as its input. And you can only input historical data.
People also have an advantage here when it comes to handicapping the future. We can use common sense, while a machine is forced to rely on events that have already happened.
That might work in situations where past performance is a reliable indicator of future results. But in the high yield world, the opposite is usually the case.
When a yield is high with respect to its historical average, that tends to be a sign of excessive investor pessimism. For example, let’s again consider OHI, which now pays an amazing 9.4%. This is only the third time in the last ten years that the stock has paid this much. Each of the last two occasions were ideal times to buy:
Historically, OHI a Screaming Buy Above 9%
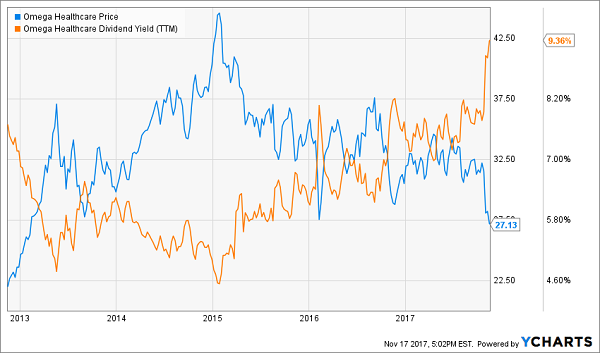
In other words, when the orange line above (yield) is high, it means the blue line (stock price) is low. This runs counter to the misleading conclusions of any backward-looking analysis, which would advise to sell low – exactly when us contrarians are smartly buying.
3 Second-Level Ways to Safely Bank 8.3% Dividends
Most of the first-level stocks you read about in the mainstream media that pay 5% or better are train wrecks. They have big stated yields for the wrong reason – namely, because their prices have been axed in half or worse over the past year!
For example, retailer Macy’s (M) pays 7.5% on paper. But its business model is toast. Next quarter’s payment may happen, but that’s a risky game I’m not willing to play.
Instead, I’d rather take the elevator upstairs and look in corners of the income world that aren’t combed over as regularly. There are three in particular that I like today. You won’t hear about them on CNBC, or read about them in the Wall Street Journal, because they don’t buy advertising like Fidelity and other firms.
Their relative obscurity is great news for us 8.3% dividend seekers.
Play #1: Closed-End Funds
If you feel trapped “grinding out” dividend income with classic 3% payers (like dividend aristocrats), you can double or even triple your payouts immediately by moving to closed-end funds, or CEFs. In fact, you can often make the switch without actually switching investments.
I’ll discuss my favorite CEFs in a minute.
Play #2: Preferred Shares
Not familiar with preferred shares? You’re not alone – most investors only consider “common” shares of stock when they look for income.
But preferreds are a great way to earn 7% and even 8% yields from the same blue chips that only pay 2% or 3% on their “common shares.”
I’ll explain preferreds – and my favorite tickers to buy – after we finish our high yield hat trick.
Play #3: Recession-Proof REITs
The IRS lets the REITs I mentioned earlier avoid paying income taxes if they pay out most of their earnings to shareholders. As a result these firms tend to collect rent checks, pay their bills and send most of the rest to us as a dividend. It’s a sweet deal.
Not all REITs are buys today, however – landlords with exposure to retail space should be avoided.
That’s easy enough to do. I prefer to focus on REITs that operate in recession-proof industries only. I want to receive my rent check powered dividends no matter what happens in the broader economy.
Now let’s discuss how you can get a hold of my complete “8.3% No Withdrawal Portfolio” research today, along with stock names, tickers and buy prices. Click here and I’ll share the specifics – and all of my research – with you right now.
Recent Comments