
Boring is perfect when we’re talking retirement investing.
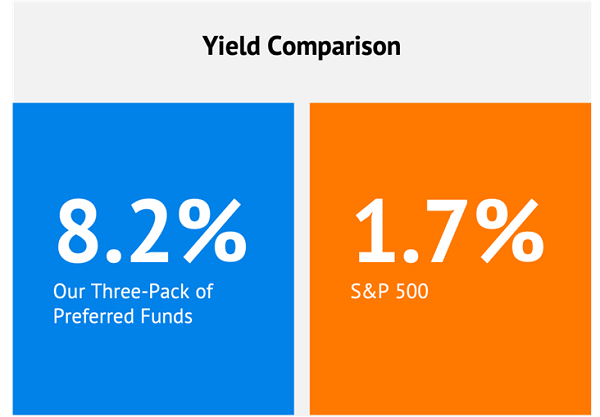
We’ll let others take the S&P 500’s sad 1.7% yield and frequent mood swings. While we direct our attention to an elite trio that yields 8.2%.
You read that right. Eight-point-two-percent per year… in dividends alone! That’s an excellent $82,000 in annual income on a million dollar portfolio. Or $41,500 on a $500K nest egg. You get the idea.
Plus our yield cushion will help soften a September selloff. (Because let’s face it, this is most likely a bear market rally we’re in the middle of.)
No, the stock market doesn’t just give out 8.2% yields for nothing. We need to look in under-owned and underappreciated corners of the income world. Like preferred dividends.
Preferred Yields are Hybrids
The modest “preferred stock” is called a hybrid because it shares properties with common stocks. Preferreds also mimic bonds in a few pivotal ways.
- Like common stock, preferreds trade on an exchange and represent equity in the underlying company.
- But like bonds, preferreds typically don’t have voting rights, often trade around a par value and deliver a fixed amount of income.
They also have a few great perks all their own:
- They have “preference,” which means their dividends are paid out before common-stock distributions. It’s a little extra protection from having your dividends cut or suspended when times are tight.
- They sometimes pay “cumulative” dividends, which means even if a company misses a dividend payment on its preferred stock, it must make up that payment before issuing dividends to common shareholders again.
- Huge yields. Most preferred stocks offer way more than their company’s underlying common. For instance, Citigroup (C) yields 3.9%, but its Series J Preferreds yield well more than that, at 7.2%. More striking is conglomerate Danaher (DHR), whose commons yield a paltry 0.4% while its Series B Preferreds dole out a cool 5%.
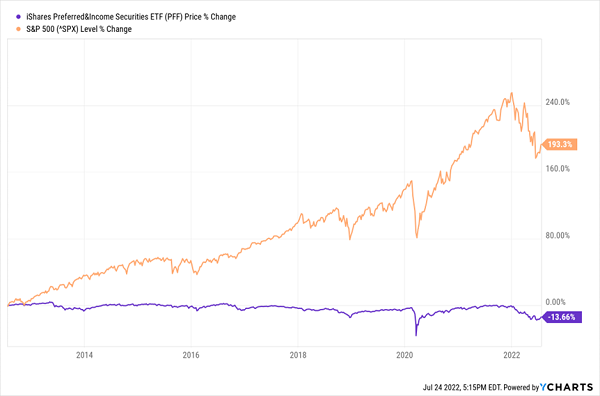
The thing is, preferreds typically are quite stable. A look at the chart below—which only indicates price performance, and not what you get with dividends included—shows that a popular preferred exchange-traded fund (ETF) has been virtually flat across most of the past decade. But it’s currently mired in its second-biggest dip in that time, only behind 2020’s COVID panic.
Preferreds (Usually) Keep It Cool
That said, while we do want exposure to preferreds through funds—which allow us to buy dozens if not hundreds of shares at once, saving us from agonizing research into these pretty obtuse investments—we don’t want that exposure to come through mainstream ETFs.
Instead, we can upgrade our profits and our payouts by delving into closed-end funds (CEFs), like the three 8%-plus yielders below:
Cohen & Steers Tax-Advantaged Preferred Securities and Income Fund (PTA)
Dividend Yield: 8.1%
Let’s start out with one of the youngest closed-end funds you’re going to find: the Cohen & Steers Tax-Advantaged Preferred Securities and Income Fund (PTA). This COVID-era launch from October 2020 is currently trading at a whopping 11% discount to its net asset value (so you’re paying 89 cents for every dollar of assets, which is even lower than the CEF’s 6%-plus average discount across its short trading life.
Now, you might hear “tax-advantaged” and think “municipal…preferreds?” I get it. Any time you hear “tax-advantaged” as it relates to a fund, that fund tends to hold municipal bonds.
PTA isn’t quite that. Instead, this CEF “seeks to achieve favorable after-tax returns for its shareholders by seeking to minimize the U.S. federal income tax consequences on income generated by the Fund,” according to the prospectus.
It does so via two methods:
- Invest in preferreds that pay qualified dividends. Not hard; many already do.
- Achieve favorable tax treatment by holding longer, securing the better long-term capital gains rate.
The resulting portfolio actually looks like your run-of-the-mill preferred fund. PTA holds 240 stocks, three-quarters of which are from various parts of the financial sector (banks, insurers, brokers, etc.). At the moment, top holdings include a JPMorgan Chase (JPM) 6.75% preferred, two Comerica (CMA) preferreds yielding 6.25% and 6.10%, and a 6.8% from PNC Financial (PNC).
Those yields, though, sound a bit lower than PTA’s 8%-plus headline yield. And that’s because, like other CEFs, this fund’s managers have a few levers to amplify its return and yield. In this case, Cohen & Steers’ managers can invest in common stocks, government bonds, even municipal bonds to generate alpha. But its primary driver of excess return is a CEF classic: debt leverage. Right now, PTA has a sky-high 36% in debt leverage, which means management is effectively investing 136% into its favorite preferreds.
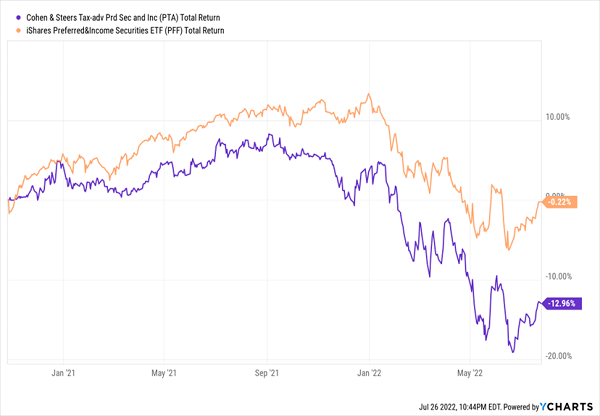
That’s great while it’s working, but it also tends to amplify losses when its assets fall out of favor, which preferreds have. Further dragging at PTA and other funds using high leverage is that old bugaboo: higher interest rates. I recently explained to my Contrarian Income Report readers that several CEFs (including preferred funds) are being hampered by higher borrowing costs thanks to rising short-term rates.
It’s the School of Hard Knocks for PTA
Flaherty & Crumrine Preferred and Income Securities Fund (FFC)
Dividend Yield: 8.4%
Flaherty & Crumrine Preferred and Income Securities Fund (FFC) is a pretty straight-laced preferred fund that’s neck-deep in financials, at nearly 80% in exposure. Citigroup (C), MetLife (MET) and Morgan Stanley (MS) are all among FFC’s top issuers.
Credit quality, at least from what we can tell, is slightly higher here: 42% of assets are in the lowest tier of investment grade (BBB), versus 38% for PTA. Meanwhile, 38% are in BB, versus 36% for PTA. I say “at least from what we can tell” because the remaining 20% is “not rated,” which only means it hasn’t been given a rating by the major debt-rating agencies. Where Flaherty & Crumrine would put that remaining 20% on the risk scale is an open question.
Now, FFC isn’t trading at a discount like PTA, but consider this: On average, over the past five years, investors have paid a premium to buy this closed-end fund—about $1.03 per dollar of assets. So the fact FFC is trading at par is noteworthy.
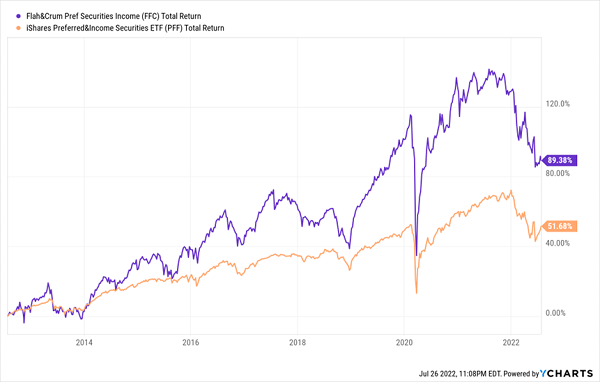
Also noteworthy, however, is a hefty 38% in debt leverage. Yes, FFC definitely has the historical performance edge over a bland preferred ETF…but that has come with its share of lumps, including a particularly nasty recent bout of heightened volatility.
Flaherty & Crumrine Still Has an Edge…For Now
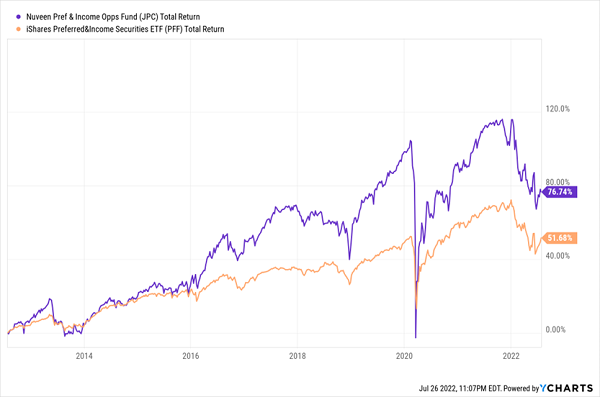
Nuveen Preferred & Income Opportunities (JPC)
Dividend Yield: 8.2%
Like FFC, Nuveen Preferred & Income Opportunities (JPC) is a longtime outperformer. Even once you factor in this year’s vicious 17% decline (which in preferred terms is virtually catastrophic), investors have been better off parked in JPC than a plain-Jane preferred ETF.
Nuveen Gets Results, But You Might Not Like How the Sausage Is Made
Nuveen delivers this solid performance with a fairly high-quality stable of preferreds. Nearly two-thirds of the 240-stock portfolio are investment-grade and even includes a tiny slug of A-rated preferreds. BBs are another 30%, leaving just a peppering of B-rated and unrated issues.
Also of note: International preferreds play a much larger role in JPC than other preferred funds, at a whopping 35% of assets right now. Indeed, overseas banks including UBS (UBS), HSBC (HSBC) and Credit Suisse (CS) are among the top 10 holdings.
It’s a good fund at a good price: a nearly 5% discount, versus a longer-term average 3% discount. But more than most funds, it will be difficult for Nuveen Preferred & Income Opportunities to get the interest-rate monkey off its back. That’s because JPC utilizes a massive 40% in debt leverage right now, making it something of a liability as long as Jerome Powell is feeling hawkish.
As I mentioned earlier, this is most likely a bear market rally we’re in the middle of, so I don’t recommend buying preferreds today. However, these three are worth keeping on your watchlist.
Your 2022 Guide to Retirement Riches: 7%-Yielding Blue Chips That Pay EVERY MONTH
We don’t want that kind of weebling and wobbling from our most productive income generators. When we retire, we need two things:
- We need stocks and funds that won’t buck like an angry bull and send us scampering for the exits.
- We need to know beyond a shadow of a doubt that a sizable dividend check is hitting our mailboxes each and every month—no exceptions.
And that means you need the “A” squad: diversified, reliable payers of mouthwatering yet dependable income that don’t knuckle under every time the economy throws a fit.
Fortunately, you can find these rare monthly dividend blue chips in my “7% Monthly Payer Portfolio.”
Many of the picks in my “7% Monthly Payer Portfolio” leverage the power of steady-Eddie holdings to generate massive yields, while also fostering the potential to generate aggressive price performance.
These dividends aren’t just good. They’re not just great, either. They’re life-changing sums of income.
It’s simple math: Even if you have just a $500,000 nest egg—which is less than half of what most financial gurus suggest you need to retire—putting it to work in this powerful portfolio now could kick-start a $35,000 annual income stream.
That’s nearly $3,000 a month in regular income checks!
Even better? The market’s recent antics have provided us with a rare gift, pulling all of these monthly dividend stocks back into our “buy zone,” where we can grab them at bargain prices. Click here for details right now!
Recent Comments