
With the first quarter behind us, now is a good time to ask ourselves if stocks—and especially 8%+ yielding closed-end funds (CEFs)—are getting just a little ahead of themselves.
Let’s start with stocks, then we’ll get granular, looking at how CEFs (which usually lag stocks by a few weeks) are setting up as we move deeper into Q2.
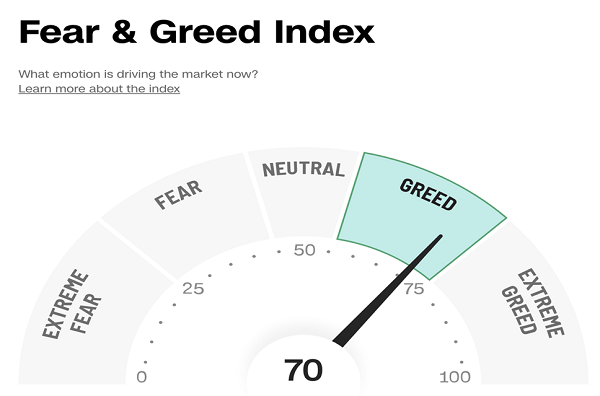
Source: CNN
One glance at the CNN Fear and Greed index and you could be forgiven for thinking things are getting a bit too hot out there. This indicator— a useful indicator of investor sentiment—was pegged at extreme fear for most of 2022, so the reversal was inevitable. And, as always, it’s translated straight into stock prices:
Too Enthusiastic?
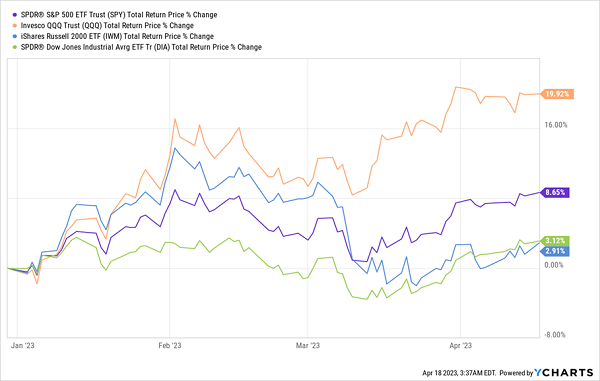
The standouts here are the tech-heavy NASDAQ—shown in orange by the performance of the benchmark Invesco QQQ Trust (QQQ) above—rallying to a near 20% total return for the year. And of course the S&P 500, whose benchmark SPDR S&P 500 ETF Trust (SPY), in purple, which has delivered more than a typical year’s worth of returns in just over three months.
These are huge gains that, on the surface, suggest a pullback is likely. But we need to also remember that contrarian investing means going beyond first-level clues such as a runup in the stock market. Because a bull market can—and often does—continue higher, even when it looks overbought.
Is that what we’re in for now? A hint comes from benchmarks for the large cap Dow Jones Industrial Average (in green above) and small cap–dominated Russell 2000 (in blue). Both have posted meager, but still positive, gains for the year. But notably, both went negative in 2023, which the broad-based S&P 500 and tech-centric NASDAQ have not done since the first few days of the year.
The Secret of Risk Rotation
This is a clear sign that our bull market is likely to continue, and for a pretty obscure reason. At a high level, big investors, like pension funds, hedge funds and the like, try to limit short-term downside by pivoting assets from one index to another. So they’ll go into the lower-volatility (and also lower-returning) Dow when they think the market is about to dip, then focus on the volatile (but more growth focused) small cap–based Russell 2000 when they think the market is likely to perform well.
Risk Appetites on Display?
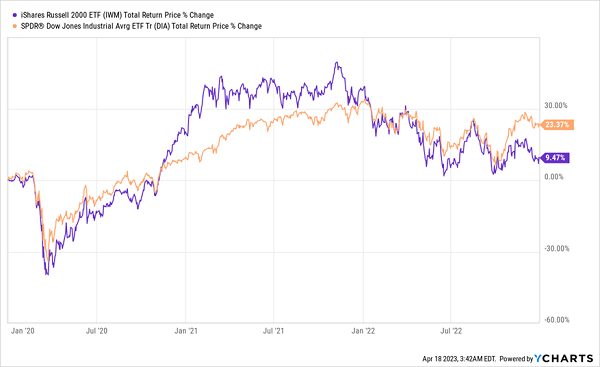
This chart clearly demonstrates how large institutions play these two indices. When the market saw its biggest existential threat in a century when the pandemic started, the Dow outperformed (hence the orange line was above the purple until positive vaccine news broke in late 2020).
Then, when the world looked like it was going back to normal in 2021, the riskier purple line outperformed. Finally, in 2022, when inflation changed the mood from extreme greed to extreme fear, the orange line moved ahead.
So what do we make of the present day, when both small caps and the Dow are lagging the S&P 500 and NASDAQ? It seems that investors, at least so far, are not really convinced that the market is either too hot or too cold. And when we zoom out over the last two years, that makes sense.
Short-Term Pain Takes a Bite
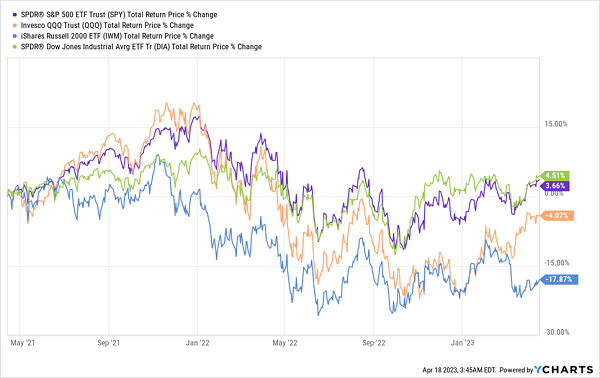
Last year’s bear market pulled everything down, and while the Dow Jones and S&P 500 (in green and blue above) are slightly positive in the last 12 months (with dividends invested; they’re still down on a price basis), the drag on prices last year was so large that this year’s bull market is tiny in comparison.
Putting It Together—With Cash in Hand
The long and the short of it is that this looks like the beginning of a recovery, where the market strives to get back to its long-term trend of giving investors about an 8% return per year, on average. Last year killed that for a while, which means that all of the indices could end this year up 20% and still be relatively underbought from a long-term perspective.
Thus, while CNN is correct in seeing a lot of greed out there, that doesn’t mean it’s time to be a contrarian and sell. Instead, we need to be smart contrarians and buy—while waiting for signs that things are getting too hot.
This is where our closed-end funds (CEFs) come in, for three reasons:
- Big dividends: 7%, 8% and even 10% payouts, as members of my CEF Insider service know, are common with CEFs. So you’re essentially getting the market’s long-term average yearly return in dividends alone here.
- CEF investors tend to move slower than those who buy “regular” stocks, so when we buy stocks through CEFs, it’s essentially like buying those same stocks a few weeks ago, when prices were lower.
- Plenty of CEFs still trade at big discounts to net asset value (NAV, or the value of their underlying portfolios). That gives us the chance to buy in and ride those discounts as they close, pulling our CEFs’ prices up alongside them.
To take one example, consider the abrdn Total Dynamic Dividend Fund (AOD), an 8.4%-yielding CEF with Apple (AAPL), Microsoft (MSFT) and AbbVie (ABBV) as its top-three positions. This fund’s portfolio is spread across cyclical, tech, financial and healthcare sectors, so you’re getting a lot of high-quality companies that were oversold in 2022—and still haven’t fully recovered.
AOD’s Recovery Is AOD’s Doing
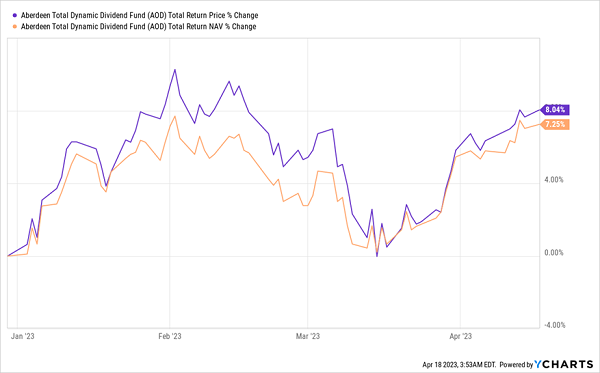
The best part about AOD is that it is recovering with the rest of the market, hence its NAV return (in orange above) is 8% so far this year. Meanwhile, its 8% market-price gain doesn’t show much of an aggressive bid for AOD from investors. In other words, AOD’s discount of 13.7% hasn’t changed much from the 14.1% discount it started the year with.
Consider also that AOD’s discount was around 7% before 2022’s bear market, meaning there’s a lot of room for its market price to rise, both thanks to a rising NAV and rising demand for the fund from investors. And AOD holders are nicely lined up to get those capital gains, on top of the fund’s 8.4% yield.
5 Monthly Paying CEFs Set to Surge as “Slowpoke” Investors Buy In
Even though CEF buyers are a cautious lot, there’s no way they’ll be able to resist the big discounts and dividends on offer here for very much longer.
When they (inevitably) roll back in, we’ll be waiting with my top 5 top monthly paying CEFs to buy now. They boast bigger payouts than AOD—I’m talking an average yield of 9% here—plus deeper discounts, too.
As the siren call of those discounts and fat monthly dividends draws in the CEF crowd, I expect those discounts to snap shut, catapulting these funds’ share prices as they do.
The upshot? We’re looking at an average yield of 9% from these dividend machines, plus potential for double-digit upside in the next 12 months, too!
Recent Comments