
Look, we’re all contrarians here at Contrarian Outlook. It’s right in the name, after all. But even we contrarians have to pick our battles. Because sometimes what sounds like a canny contrarian move can turn out to be, well, too cute by half.
A good example is buying counter to the VIX, which you may know as the market’s “fear gauge.” It’s a common contrarian belief that when the VIX is low (as it is today) and the market is relatively calm, it’s a good time to sell. And when the VIX is high, and mainstream investors are in a panic, it’s a good time to buy.
There’s even a catchy rhyme for this: “When the VIX is high, it’s time to buy. When the VIX is low, it’s time to go.”
It makes sense. Heck, it can even make you money from time to time. But there are exceptions—and today is one of them.
In fact, by ignoring this advice and buying into today’s low VIX, we could set ourselves up for a nice double-digit gain, with a big part of that in dividends if we invest our cash in discounted closed-end funds (CEFs), whose payouts eclipse 7% on average today.
Let’s get into it, starting with how the VIX works—and why history, and corporate earnings, tell us now is the time to ignore silly investor slogans like this one and buy.
The Long and the Short of the VIX
The Chicago Board Options Exchange’s volatility index, or VIX, is a popular barometer of how the market is feeling. It’s calculated by finding the square root of the expected variance of the S&P 500 over a 30-day period. Sounds fancy, but all it really means is the VIX is calculating how much the market will go down—or up—relative to what it’s been doing for the preceding 30 days.
A Downtrend in the VIX …
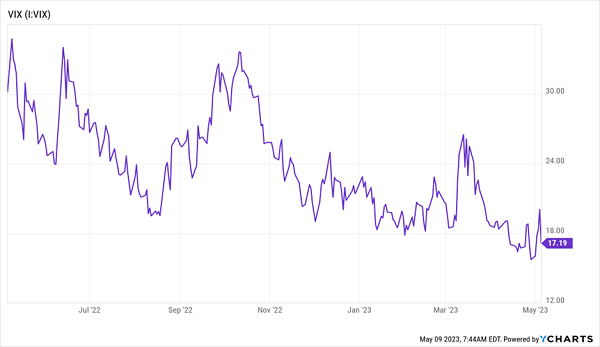
Overall, the markets have been relatively calm in 2023, and stocks have risen more or less steadily, with the exception of most of March, when the banking crisis captured headlines.
That movement was reflected in the VIX, which generally moved lower from the start of the year to the beginning of March, when the failures of Silicon Valley Bank and friends sent it up above 25, it’s year-to-date peak. Even so, that’s still far below its 2022 peak of 35.
Lately the VIX has fallen back below 20, reflecting a market that’s gained some 4.6% since March 1—a period that included the banking crisis.
…Reflects a “Normal” Gain in Stocks
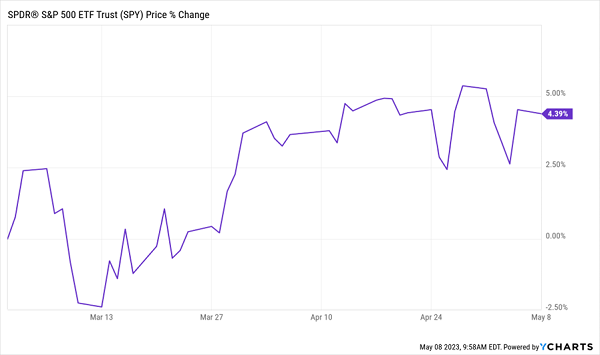
That’s an average return of a bit over 2%, a little above the 1.24% the market normally returns during this period, but not overly so. And as the VIX is based on the last 30 days of price action, the market recovery since early March meant that, on the whole, this indicator has been less volatile than it normally would be in a regular 1.24%-returning period, in which the variance in stock prices is often quite a bit greater.
Source: Stockanalysis.com
Importantly, since this timeframe also includes the banking crisis, this means this event was not, historically speaking, a major market mover. I wrote this repeatedly over the last few months, and now the math is echoing that belief in the form of a falling VIX.
Low VIX = Calm or Complacent Market
The reason why a few Wall Street veterans say “When the VIX is low, it’s time to go” is because they think a low VIX means a complacent market. But since it measures variations in pricing, it also reflects a calm market, and the March and April markets have been just that compared to previous periods of market volatility. Hence the disconnect between what the stock market is saying and the alarming headlines we’ve been reading in the financial press.
But here’s the thing: of the hundreds of analysts, portfolio managers, hedge fund principals, brokers, bankers, analysts and journalists I’ve met since getting into this business in the early 2010s, I have not once heard anyone say this, even when the VIX dipped to 9.97 in 2017, its lowest point since 1993.
And this chart explains why.
When the VIX Is Low, Sometimes Don’t Go
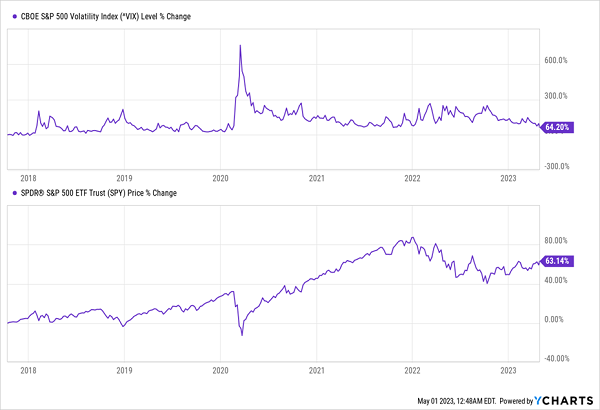
Investors who ignored the rhyme would’ve earned a 10.3% annualized return since the VIX hit its all-time low back in 2017—higher than stocks’ long-term average of 8% yearly gains. That’s a solid return during a period that included rising interest rates and, of course, a global pandemic. Yet in all of that chaos, stocks returned 10% a year to those who supposedly bought at the worst time.
And that’s excluding dividends! Those bring the total return up 12.4% annualized.
Clearly, sometimes when the VIX is low it isn’t time to go. And, I’d argue, this is one of those times. Consider the following chart:
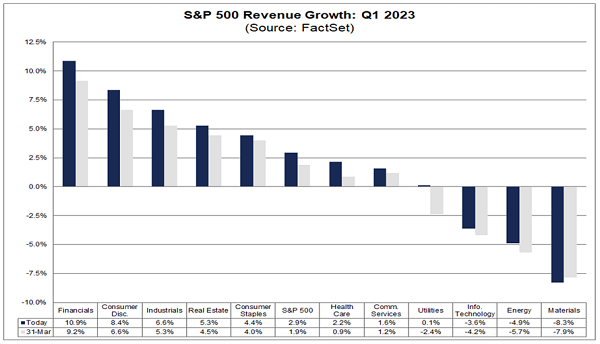
In the last quarter, S&P 500 companies saw revenues grow about 3%, with 74% of S&P 500 companies beating sales estimates. Revenues have grown 9.5% since the start of the pandemic, they’re at a historical high, and they show no signs of reversing.
S&P 500 Revenue Hits New Record
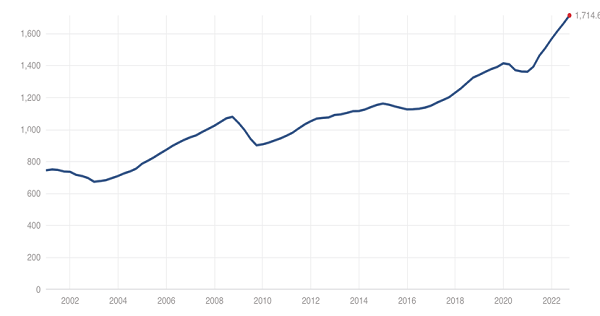
Source: Multpl.com
So if you think a low VIX is a reason to sell, just consider what you are giving up: companies with fast-growing, record-breaking sales beating estimates at a three-to-one ratio. That’s yet another sign we’re looking at a buying opportunity rivaling the one experienced by those investors who bought the historically low VIX back in 2017.
5 Terrific “Low VIX” Buys for Safe 9%+ Dividends (and Monthly Payouts!)
As I mentioned a second ago, your best buys at a time like this are closed-end funds (CEFs), due to their high yields—many CEFs yield 8% and higher!—and the fact that many CEFs are still absurdly cheap following the 2022 market collapse.
And here’s something else many folks don’t realize about CEFs: most pay dividends monthly. No more waiting around for three long months for your next payout!
Recent Comments