
There’s a three-word phrase that’s terrifying just about everyone these days. If you take it at face value, it could trick you into making a dangerous mistake with your retirement.
It springs from the following chart:
The Yield-Curve Panic
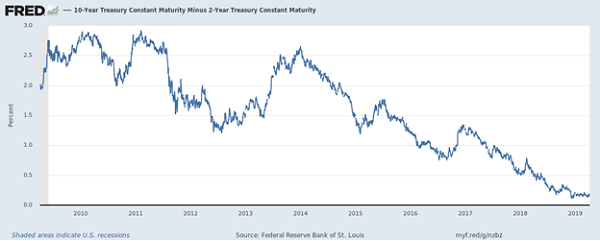
This chart tracks the spread between yields on the 10-year Treasury and the 2-year Treasury. In normal times, the shorter-term bond pays a smaller yield than the longer-term bond. But the difference between the two has gotten smaller and is now close to going negative.
That’s where our dangerous phrase comes from: this situation is known as an inverted yield curve.
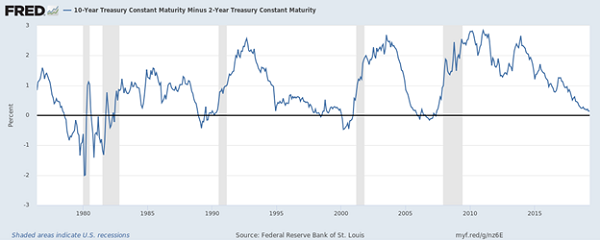
The upshot? Every time the yield curve has inverted, a recession has followed, as you can see in the chart below (the shaded areas indicate recessions):
Tough Times Ahead?
In fact, we’ve already seen the 10-year Treasury yield invert with the yield on an even shorter-term note:
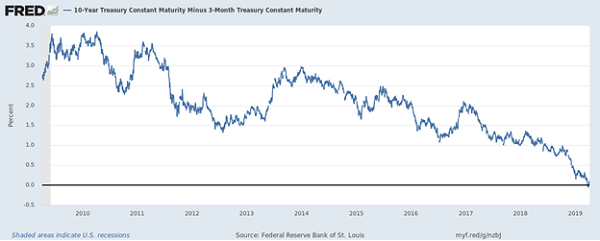
This is the spread between the three-month and 10-year Treasuries, which, as you can see, went negative at the end of March. Some pundits have said seals the deal: a recession is imminent. And thanks to the recent stock run-up, many are saying that now is the time to sell.
Don’t take the bait. As my colleague Brett Owens recently wrote in “3 ‘Yield-Curve-Proof’ Buys for 7%+ Dividends and Upside,” now is the time to buy, with a touch of prudence as we do.
Why Now Is Not the Time to Worry
How can I be so sure we’re still on solid ground here?
It all comes back to history—and the fact that there’s a massive gap between the inversion of the yield curve and the onset of a recession.
This is something you rarely hear about. In fact, when you hear warnings of recession doom and gloom, there’s always a panicked tone, as if the collapse is just around the corner. That’s because doom and gloom sells.
But the hype is just that: hype. There is, in fact, over a year and a half, on average, between an inversion of the yield curve and the start of a recession:
| Date of First Yield Curve Inversion | Date of Recession | Time Delay (days) |
| August 18, 1978 | January 1, 1980 | 501 |
| September 12, 1980 | July 1, 1981 | 292 |
| December 13, 1988 | July 1, 1990 | 565 |
| May 26, 1998 | March 1, 2001 | 1010 |
| February 2, 2000 | March 1, 2001 | 393 |
| December 27, 2005 | December 1, 2007 | 704 |
| Average delay: 577.5 days |
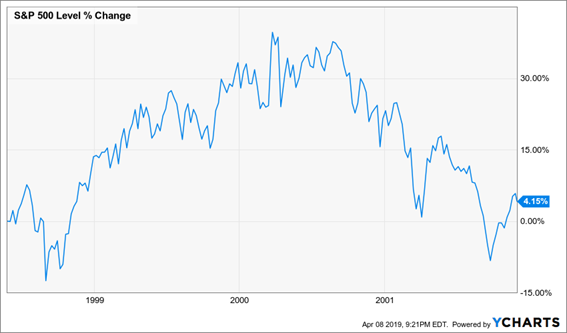
Look at the dot-com-bubble yield inversion of 1998, which occurred a staggering 1,010 days before the recession began! If you sold the day that inversion started and bought back when the recession ended in November 2001, you would have missed some serious upside (not to mention dividends and dividend growth, too):
“Inversion” Triggers Big Market Spike
In finance, they say being right and too early is the same as being wrong, and this is why. However, what if you waited the average 577 days after the curve inverted to sell and then bought again when the recession ended? Here’s where things get interesting:
Patient Move Helps Sidestep Drop
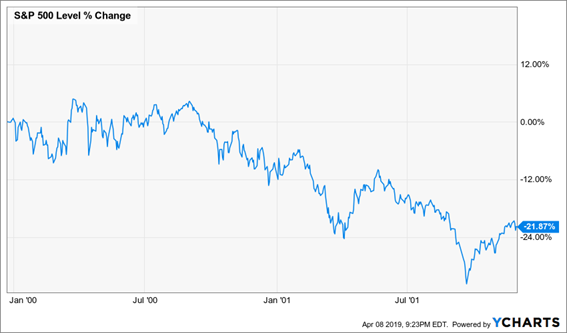
This more patient move would have helped you avoid a 21.9% downturn over a two-year time period. (Note, however, that we still don’t recommend selling on indicators like this, because you’ll of course miss out on dividend payouts, like the 7.1%, on average, my CEF Insider portfolio is delivering now. Moreover, the market quickly recouped that decline anyway.)
Forget the Yield Curve: Here’s When to Expect the Next Recession
Let’s fast forward to today. While we aren’t at a yield-curve inversion yet, at the pace we’re going, the yields on the two-year and 10-year Treasuries will likely invert by summer 2020, assuming the last year’s rate of change continues.
Going from that, and going by the average delay from the time this indicator shows up to an actual recession (based on the last six recessions), that would mean we’re due for a recession to start at the very end of 2021. In other words, we have over two and a half years of growth to go before we need to even even think about a recession coming.
Your takeaway is simple: relax. The long expansion that was ahead of us years ago is no longer here, but there’s no need to panic. In fact, while it’s wise to be more cautious than we needed to be in, say, 2012 or 2013, we’re still likely looking at plenty more stock-market gains ahead.
What to Buy Now
You know me: I’ve got 4 CEF picks for you that are perfect for today’s world, when snap market pullbacks and inverted yield curves make investing feel a lot more treacherous than usual.
Right out of the gate, these 4 battle-tested CEFs hand you a 7.5% dividend, on average. And because that return is in CASH, it’s as safe as they come—far superior to here today, gone tomorrow paper gains.
Better still, these 4 funds trade at ridiculous discounts to net asset value (NAV, another way of saying the value of the stocks and bonds they hold) as I write this.
That sets up a rare “heads you win, tails you win” scenario!
- If the market stumbles, these high-yield plays will likely just trade flat, and …
- If the market takes off, their bargain valuations will slingshot them even higher!
The bottom line?
With the next recession still a long way off, I’m calling for fast 20%+ price upside from each of these 4 funds. I think you’ll agree that a gain like that pairs nicely with the 7.5% dividend on offer here.
But this ideal buy window won’t stay open for long. Click here to get everything I have on each of these 4 ironclad funds—names, tickers, buy-under prices and my complete analysis of how they work and, most importantly, how they pay out their massive (and growing) dividends.
Recent Comments