
Today I’m going to show you a closed-end fund (CEF) yielding 13.7% that sounds—and is—too good to be true.
If you hold it, now is the time to sell.
The fund I’m talking about is Eagle Point Credit Company (ECC). Today we’re going to dive into all the reasons why ECC is a CEF to avoid. I’ll also give you five takeaway tips you can use to steer clear of funds like it in the future.
Let’s get started.
CEF Danger Sign No. 1: NAV and Market Price Go Haywire
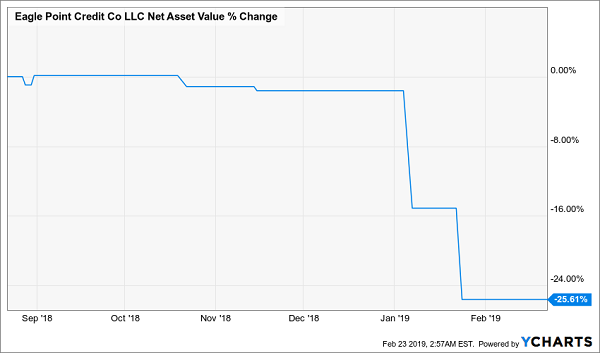
As you can see below, ECC recently saw its net asset value, or NAV, plummet 26%, erasing three years of gains overnight:
ECC’s Underlying Portfolio Collapses …
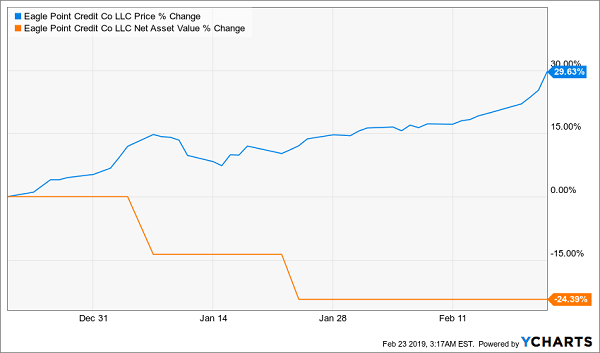
In a normal situation, you’d expect investors to sell fast. But in the world of CEFs, things don’t always happen that way. Zooming in on the past two months, when this NAV crush occurred, we see that the fund’s price actually soared.
… And Investors Cheer!?
This is obviously an extreme example, but when a CEF’s market price soars while its NAV heads south, it’s time to pay extra attention. Which leads me to my second red flag.
CEF Danger Sign No. 2: What Goes Up …
The widening chasm between ECC’s market price and NAV has put the fund’s investors in a dangerous spot, because it’s sent its premium to NAV soaring to the highest point in history in a very short period—and that can’t last. Check out this chart:
Stratospheric Premium Has One Way to Go
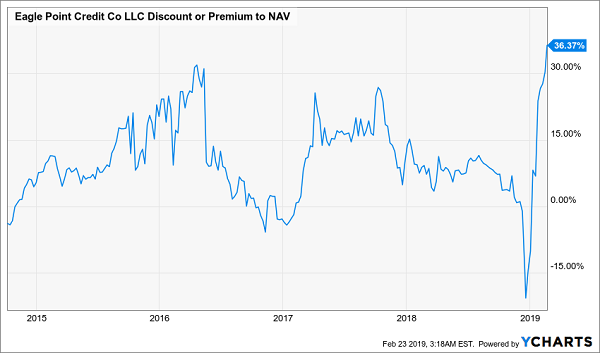
Such a poor NAV performance shouldn’t be rewarded with such a high premium, yet here we are. That leads us to the inevitable question: what caused ECC to lose a quarter of its NAV so quickly—and why didn’t investors respond immediately? Cue up my next warning sign.
CEF Danger Sign No. 3: The Fund Holds Complex, Hard-to-Value Investments
A major problem with ECC is that it only announces its official NAV with every quarterly earnings release, along with a rough estimate every month. This isn’t the norm for CEFs. Of the near-500 CEFs tracked by CEF Insider, 99% report NAV on a daily basis. But you don’t know what ECC’s portfolio is worth until it announces earnings each quarter.
This has to do with the collateralized loan obligations (CLOs) ECC invests in. CLOs are a type of derivative on loans similar to the mortgage-backed securities that tanked the economy in 2008.
CLOs pool a variety of loans, then cut these pools into sections investors can trade on the secondary market. These complicated assets aren’t traded daily, which makes it tough to mark them to market (or determine their NAV if they were all sold immediately). That’s why ECC only does this once a quarter.
As a result, you could buy ECC at what you think is a big discount only to find out, days or weeks later, that you actually bought at a premium.
CEF Danger Sign #4: High Fees
ECC is also expensive from a fee perspective, as we can glean from the table below.
High Fees Hurt Shareholder Profits
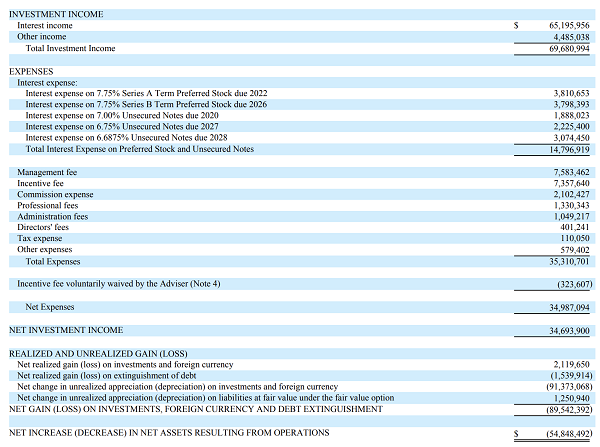
Source: Securities and Exchange Commission
There’s a lot going on here, but you only need to look at two numbers: total investment income of $69,680,994 (near the top) and $34,987,094 in net expenses (two-thirds of the way down). Over half the fund’s profits went to a variety of fees! As a result, ECC’s fees amounted to a whopping 12.3% of its NAV in 2018.
CEF Danger Sign No. 5: A Shift in the Fund’s Sector
I’ve left the biggest reason for ECC’s underperformance for last: the late-2018 market crash and a sea change with CLOs themselves. If we look at the Palmer Square CLO Debt Index, we see that CLOs’ value took a hit at the end of 2018—as did just about everything else:
A Massive Drop for CLOs
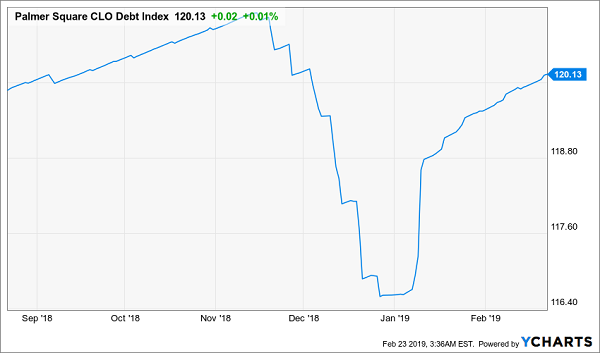
As a CLO fund, ECC is expected to drop with the index, but we should still ask why the index plunged in the first place. Late 2018’s selloff is part of the story, but interest rates are another part. That’s because CLOs have benefited from the rising-rate environment we’ve seen since 2015, as higher rates boost their interest income:
CLOs Rise With Rates
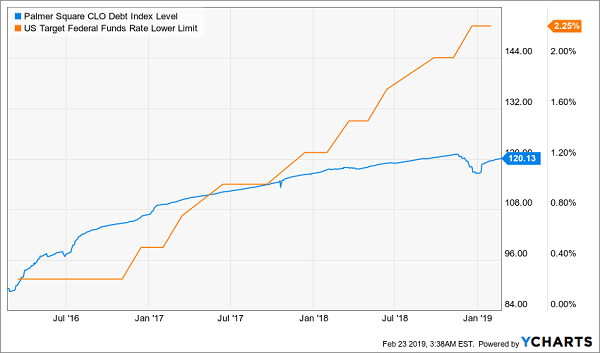
However, the Federal Reserve has made it clear that the aggressive rate-hike plans it laid out in 2018 won’t happen in 2019. And the fact that CLOs had priced in a long string of rate increases caused them to crash in late 2018.
They should have stayed down, but irrational exuberance kicked in, making CLOs—and ECC itself—overvalued again.
Revealed: the Best 7.5%+ Dividends for Your Retirement Portfolio
Right now I’m pounding the table on no less than 15 funds throwing off some of the juiciest yields on the market (including one “unicorn” paying an outsized 9.9% payout!).
And these 15 cash machines are primed for double-digit gains in the coming 12 months, too! You can get the names of all 15 when you take a no-risk trial to my CEF Insider service today.
Simply CLICK HERE to start your trial now. When you do, you’ll get instant access to the names, tickers and all my research on each of the 15 buys in the service’s portfolio.
These 15 bargain CEFs trade at absurd discounts to NAV that are slowly narrowing. That puts a relentless lift under their share prices and sets us up for market-crushing gains heading straight into 2020!
But the best part—by far—is the dividends.
Right now, the portfolio boasts an average yield of 7.5%. But that’s just the average! Cherry-pick my 3 highest-yielding CEF buys and you’ll pocket life-changing payouts like 9.9%, 9.8% and 8.5%!
I hope you’ll take this no-risk opportunity to join the small group of investors pocketing regular dividend checks—every month—from these terrific funds.
Best of all, I’ll also GIVE you my latest Special Report FREE!
This exclusive guide reveals the names, tickers, buy-under prices and more on 4 of my favorite CEFs for 2019. Grab these 4 cash machines now and you’ll trigger a huge income stream and position yourself for fast 20%+ upside, too!
Don’t wait. CLICK HERE now to get your copy of this revealing FREE report and start your no-risk trial to CEF Insider now.
Recent Comments