Checking in on Some Key Charts
Major indices hit new recovery highs today, with the DOW hitting it’s highest mark in the last 18 months.
Trading volume remains tepid, however – as you can see from this chart of the S&P 500, this recent rally appears to lack some conviction:
While US markets climb everyday, China huffs and puffs.
(Chart courtesy of Yahoo Finance).
Regular readers know that China is one of our favorite leading indicators. Is China’s recovery running out of steam already?
The experts at Stratfor Global Intelligence believe that China’s economy will be run on lending for at least the next year (free video clip here) – the result of which remains to be seen.
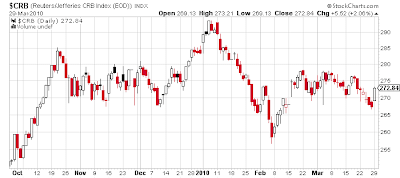
Like Chinese stocks, commodities are also well off of recovery highs.
Bottom Line: These non-confirmations could be ominous bearish divergences, indicating the reflation rally is on it’s last legs. The rally appears tired, but is not over yet.
On the other hand, if all 3 of these charts confirm new recovery highs together, we’d have to conclude that this rally still has some room to run.


Recent Comments