We’ve taken a fun exploratory look at internet search terms and their potential correlation (or lack thereof) with financial asset prices before (See: Using Google Trends as a Leading Indicator).
That piece actually found its way to Google Headquarters in Mountain View, as I was contacted by someone from Google Finance who asked if I’d done any additional research on the topic! And I unfortunately botched that connection by not figuring out how to access my email address for this site until two months later!
It’s a topic I’d like to continue to explore, so I was very interested to see this guest piece on The Big Picture entitled Google Trends – A fresh look at search frequency.
“Stock market crash” was a leading indicator.
An interesting case study of this is a search for the term “market crash” or “stock market crash”, backed up to the very start of the market crash itself.
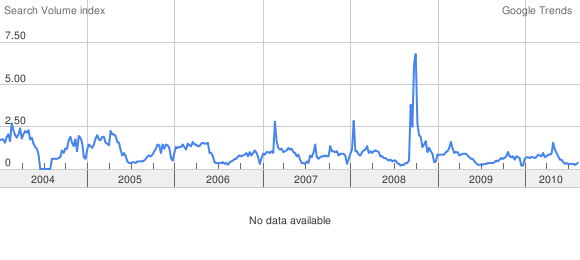
This is the graph of search frequency for “stock market crash”, which is largely similar to that for “market crash” (chart):
Note the clear peak in September 2008, with nothing really before that. The January 2008 spike was largely the same as what we saw in ~February 2007.
The simple response to this is “oh yeah, this simply peaked while the crash was happening”… but that might be a false assumption.
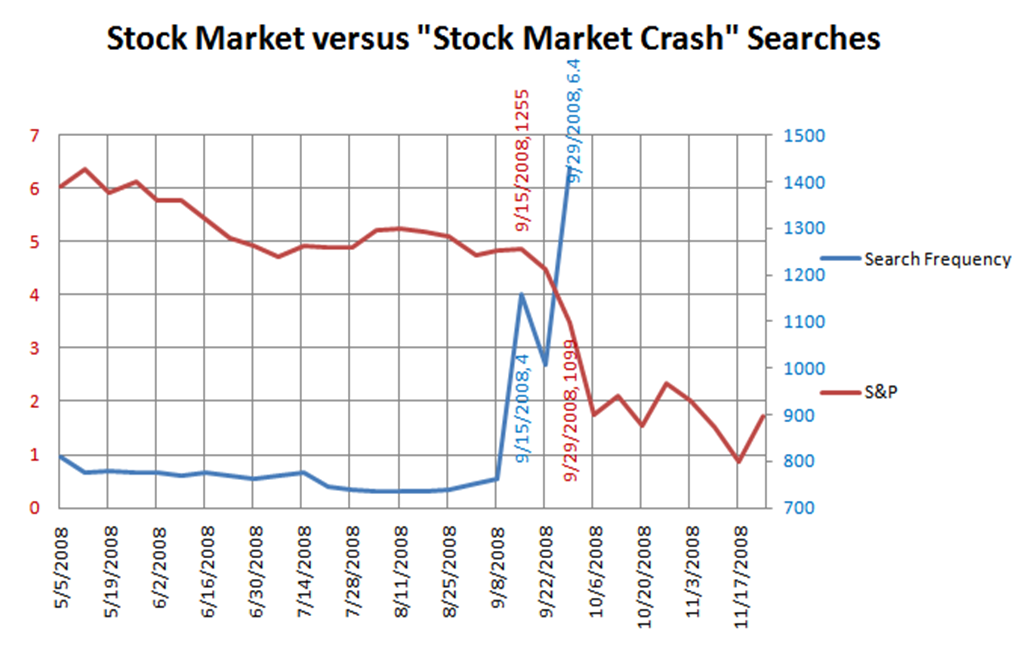
Digging into the weekly data seems to paint a different picture, interestingly enough. We got a reading of 4 in the chart above on … September 15th 2008 (chart):
On September 14th, the S&P was at 1255. Heck, even when Search Terms went to 6.4, the S&P was still at a fairly rich 1099.
In other words, a spike to 4 actually *led* the crash, and was *not* a lagging indicator after the fact.
The author also explores the recent housing bubble and its search relationship, while looking ahead at what current hot terms “double dip” and “bond bubble” may have in store for the future. You can read the full piece here.


Recent Comments