
This high-yield sector is being taken to the woodshed by the Wall Street spreadsheet jockeys this year.
The contrarian opportunity? Big yields up to 15.6% in BDC Land. Some of these deals are trading for as little as 72 cents on the dollar.
Which means opportunists like us have been handed something rare: wild yields of 11% to 15.6% for as little as 72 cents on the dollar.
Business development companies (BDCs) are “Main Street bankers” because they do what Wall Street won’t: provide capital to small and midsized businesses that the big banks either ignore entirely, or won’t touch without demanding a firstborn as collateral.
And they don’t just serve the little guys. They pay them, too—or rather, they pay us. BDCs are structured just like real estate investment trusts (REITs), with a similar mandate to distribute 90% of their profits as dividends in exchange for their tax-privileged structure.
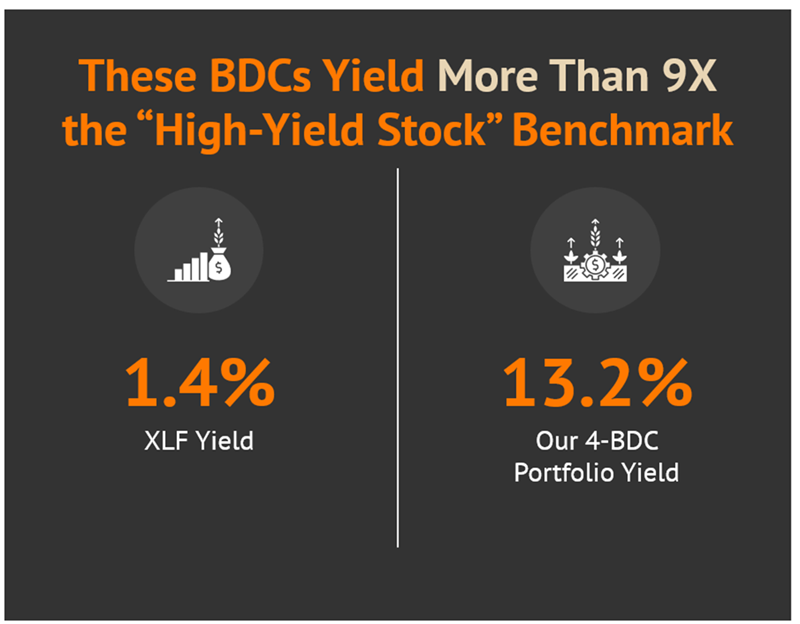
The result? An industry-wide yield that makes the broader financial sector look like it’s barely trying.
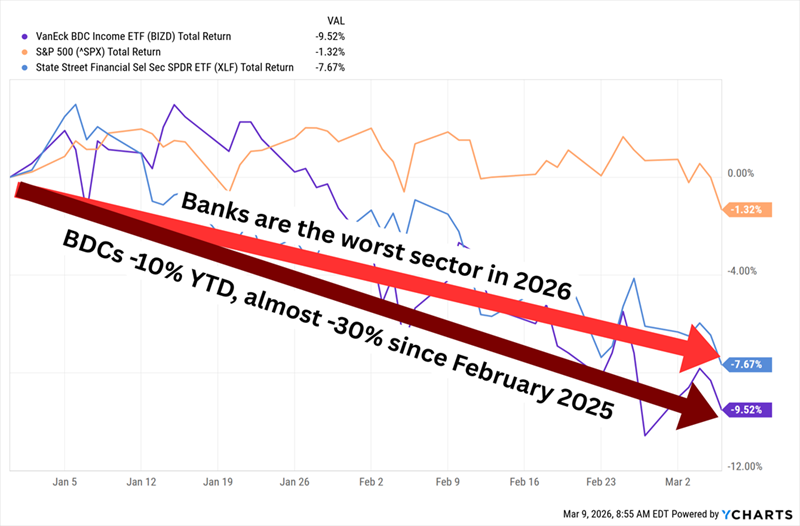
But these aren’t normal times for financials broadly, or BDCs specifically.
Despite what was an otherwise solid earnings season, banks and financial firms have taken it on the chin: mounting recession worries, skyrocketing oil prices, Federal Reserve uncertainty. It’s a cocktail of doom.
And BDCs Got an Extra Shot Poured In
Fresh fears about private credit—the primary playground of many BDCs—have rattled investors. A few months after the bankruptcy of auto-parts supplier First Brands exposed some cracks in the market, more are appearing. Companies like Blue Owl (OWL), BlackRock (BLK) and Blackstone (BX) have been selling off fund assets, merging BDCs, and quietly limiting investors’ ability to withdraw. Not exactly confidence-inspiring headlines.
BDCs are also being weighed down by the growing AI-led disruption of the software industry; a recent Reuters report says “Barclays pegs the average BDC’s software exposure at about 20%,” and reminds us that because of the asset-light nature of these businesses, “lenders risk getting very little of value in future bankruptcies.”
In short: BDCs as a whole are cheaper for a reason. Which means we want to figure out whether these 11.0%-15.6% yields are cheaper because they deserve to be—or if they’ve been thrown out with the bathwater.
Gladstone Investment (GAIN)
Yield: 11.0%
Gladstone Investment (GAIN) focuses on financing lower-middle-market companies that generate EBITDA (earnings before interest, taxes, depreciation and amortization) of between $4 million and $15 million annually. It favors firms with a proven business model, stable cash flows and minimal market or technology risk.
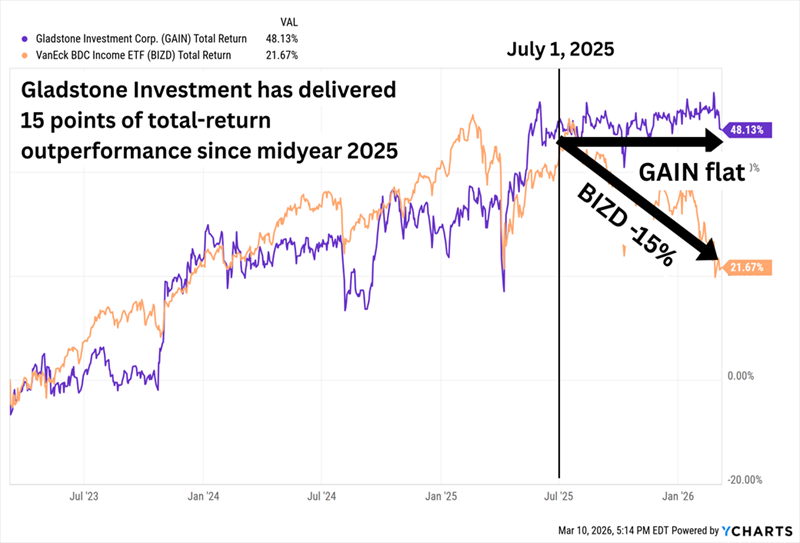
That last part may very well explain why GAIN has held up so well in recent months.
In early February, Morgan Stanley mapped out how much exposure (as a percentage of fair value) that dozens of BDCs had to both software companies and information technology service firms. The data was from Q3 2025 reports, so it’s a little behind companies that have since reported Q4 earnings, but it’s directionally helpful.
Gladstone’s relatively tiny portfolio of 29 companies, for instance, has absolutely no exposure to either field; most of its holdings are concentrated in business/consumer services, consumer products and manufacturing.
I’ve pointed out in the past that Gladstone Investment has “a much bigger hunger for equity than the average BDC.” Gladstone says the average BDC has roughly 5%-10% equity exposure, but its target mix is 75% debt/25% equity. This high amount of equity shields it more from the weight of interest-rate declines than many of its peers.
One result of this deal mix is that its regular monthly dividend comes out to just 7%—high compared to the average stock, but low as far as BDCs are concerned. That said, it also pays substantial supplemental distributions when it realizes gains on equity investments—at least once per year over the past few years, sometimes more. If we factor in special one-time distributions over the past year, that yield jumps to 11%.
GAIN’s discount to its net asset value has widened in recent months, and it now trades at 91 cents on the dollar. That’s often the result of price declines, but not here. Instead, Gladstone Investment has enjoyed a rapid rise in net asset value over just the past few quarters, from $12.99 per share as of the middle of last year to $14.95 by calendar 2025’s end.
Gladstone Has Been Able to Tread Water While Other BDCs Sink
SLR Investment Corp. (SLRC)
Yield: 11.1%
SLR Investment Corp. (SLRC) invests primarily in senior secured loans of private U.S. middle market companies, but it does have some specialties. Within that broader debt type, it specializes in cash-flow loans, asset-based loans, equipment financings and, to a lesser extent, life science loans.
Unlike Gladstone, SLR has below-average equity exposure of just 2% right now. But it still has quite a few qualities:
- Only 65% of its investment portfolio is floating-rate, so it still has some protection against drops in interest rates.
- It has an extremely high number of portfolio companies compared to the average BDC. Currently, it has 880 holdings across 110 industries.
- It also has precious little exposure to the weakening areas of tech. The company noted in its Q4 report that it has only about 2% exposure to software (and Morgan Stanley says it has no IT services exposure). Michael Gross, co-CEO, clearly read the room, writing in the release that SLRC’s assets “can be viewed as a more attractive alternative relative to increasing investor concerns about private market industry exposure to software companies.”
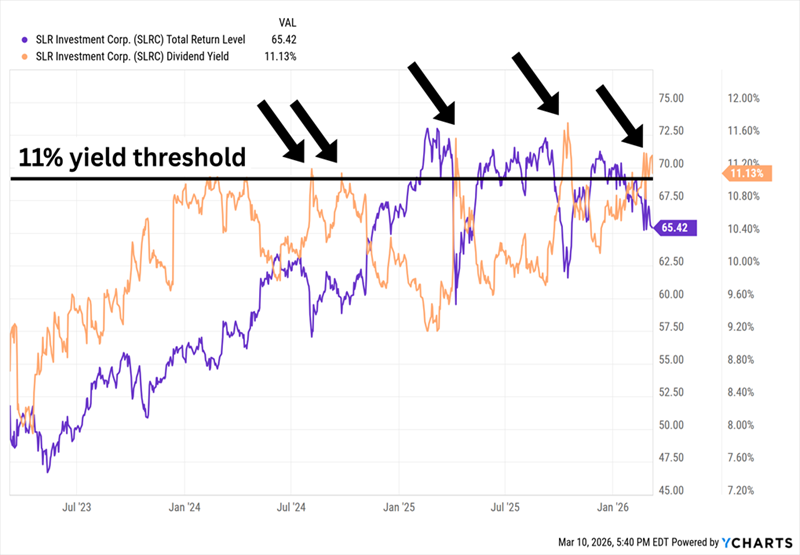
SLR Investment announced Street-matching earnings in late February—not great, but still better than the weak reports from many of its peers. Shares have been trailing off regardless, but that’s par for the course for SLRC, whose numerous volatile dips over the years open up brief windows of higher-than-average yield and deeper-than-usual discounts. Currently, SLRC trades at a 19% discount to NAV.
SLRC Doesn’t Eclipse 11% Yield Territory Often, And When It Does, It’s Fleeting
Goldman Sachs BDC (GSBD)
Yield: 15.6%
Goldman Sachs BDC (GSBD), which provides financing to companies with annual EBITDA of between $5 million and $75 million, currently invests in just more than 170 companies spanning a dozen industries.
It’s also one of several dividend payers that Wall Street’s analyst community can’t stand. Investors clearly don’t love it, either, as GSBD is perpetually sale-priced; it currently trades at a steep 28% discount to NAV.
But why?
For one, despite the resources and name recognition from its ties to mega-cap investment bank Goldman Sachs (GS), GSBD has been an absolute stinker. It also slashed its core payout by 29% in 2025, switching to a base-and-supplemental system temporarily bolstered with special dividends (on top of the base and supplementals) that have since disappeared.
The End Result: Lower Quarterly Aggregate Payouts
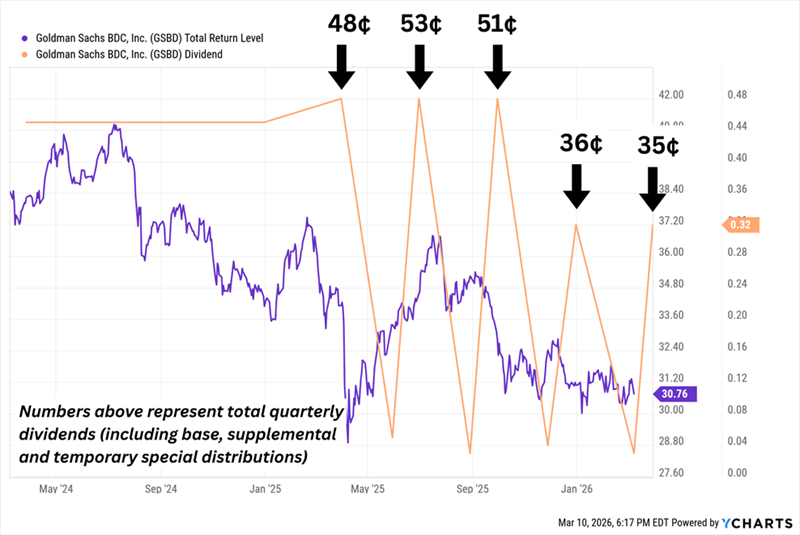
We can add another reason: High exposure to the tech industry. As of the end of 2025, software was Goldman Sachs BDC’s single largest industry by fair value, making up about 18% of the portfolio.
I’ll point out that GSBD is barely down in 2026, which is much better than many of its peers. That could be, to some extent, because the BDC isn’t taking the software risk sitting down.
The company has an AI-risk framework to evaluate all new underwriting, and it has been aggressively ditching investments it views at high risk of being disrupted. Recently, President and COO Tucker Greene admitted the company exited a software loan it had held for eight years. There were no signs of deterioration. Greene simply flipped it for $0.99 on the dollar to get ahead of future AI disruption.
PennantPark Floating Rate Capital (PFLT)
Yield: 15.2%
PennantPark Floating Rate Capital (PFLT) targets midsized companies that generate $10 million to $50 million in annual EBITDA. It currently invests in more than 160 portfolio companies spread across roughly 110 private equity sponsors.
It’s also a “value-added” BDC that lends its expertise in specific industries, hence its portfolio focus on five categories: health care, consumer, business services, government services and—ahem—software and technology.
Good news on that last bit: As of the end of 2025, PFLT sported just about 4% exposure to the software sector. And its credit situation in general is good, with just four loans on non-accrual (representing just 0.5% of the portfolio at cost).
So Why Has PennantPark Taken It on the Chin?
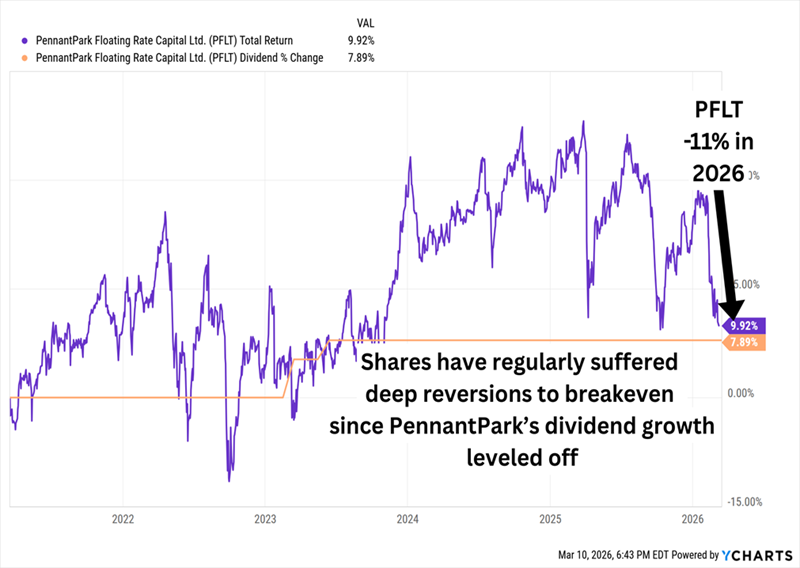
Its most recent earnings report probably didn’t inspire confidence. I’ve mentioned previously that PFLT’s dividend has been frequently outstripping its net investment income (NII). It happened again in Q4, with its core NII of 27 cents per share coming in lower than the 30.75 cents it paid across three monthly dividends. Management continues to insist that “our run rate NII is projected to cover our current dividend as we ramp the PSSL II portfolio,” referring to its PennantPark Senior Secured Loan Fund II joint venture.
Still, that NII was short of estimates, NAV declined by 3%, and the company had to mark down several investments.
It’s a precarious position—so it’s unsurprising we’re being offered a massive 15% yield, at a 23% discount to NAV, to risk it.
A Fully Paid Retirement for Just $600,000?
The 15% yield is phenomenal. So is the monthly delivery schedule.
But if we want to retire on dividends alone, we need dividends that don’t appear to be one or two more disappointing earnings reports away from being cut.
Put differently: We need the kinds of dividends you’ll find in my “9% Monthly Payer Portfolio.”
These generous stocks and funds pay up to 14.9% and average more than 9% across the board. That’s enough to live on dividends alone—without ever needing to sell a single share to generate cash.
The math on this portfolio is easy to follow:
- A $600,000 nest egg could earn $54,000—in many places in the U.S., that’s enough for a fully paid retirement without even factoring in Social Security!
- And if you have managed to stow away a cool million bucks to work with, the 9% Monthly Payer Portfolio would pay you a downright lush $90,000 in dividend income every year.
Better still? You’d be cashing dividend checks not annually, not quarterly, but each and every month. That means no “lumpy” payouts. No complex dividend calendars. No dumping money into certain stocks because you’re getting underpaid every third month.
Just paydays as smooth as when you were collecting a paycheck!
Don’t miss out on these terrific income plays while you can still get in at bargain prices. Click here for all the details, and turn your portfolio into a monthly dividend machine.
Recent Comments