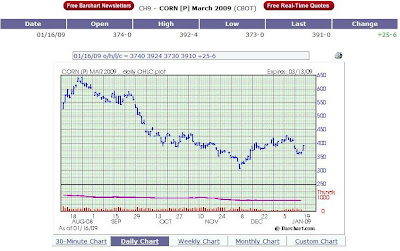
On Monday, the USDA released it’s agriculture supply and demand projections, which sent grains “limit down” for the day across the board, and many of the softs down sharply as well.
That proved to be the worst of it – as grains slowly recovered during the week as the market digested the news, finishing the week off with a sharp rally on Friday.
As you can tell from my positions as of last Sunday, I was not prepared to handle a “limit down” day across the grains board. It’s one of those days that, as a leveraged trader, you just want to vomit.
I had an offsite meeting in the morning, so returned to the home office after markets had closed to see the carnage. Not only was I down 25% (!) on the day, but also still had these positions open. Everything had closed limit down, and I had no clue where this market was going to find a bottom – and even when I’d be able to get out of these positions.
Fortunately I was able to get out that evening during the Asian trading sessions – basically covered the grains positions and also my Treasuries short, leaving only cotton open.
Then while sipping some wine and reading the WSJ later that night, I read analysts mentioned they liked soybeans more than corn. So the next day, I went long soybeans, and short corn – nothing like a little wreckless pair trading to get over a big loss.
Well this trade actually held up OK until Friday morning, when, bless his heart, my commodities broker Robert gave me a call.
“Brett, I’d really like to get you in on this corn trade. It’s trading $0.50 below the cost of production. Farmers are already switching to soybeans.”
After picking Robert’s brain for about 10 minutes, I had him put the trade through for me (he manages my Rollover IRA account), and ran to my computer here to cover that corn short, and then go long.
Phew – not a moment too soon – corn finished the day on a sharp rally.
Yesterday I did some online research and found that, indeed, it could be a difficult year for corn farmers. $4 corn ain’t what it used to be for these guys, with input costs sharply higher these days.
We’ll continue to watch the corn markets closely.
Recommended reading:
- Doug Casey believes we’ve begun what he calls “The Greater Depression.” In this insightful article, he explores the foundations of the current crisis we’re facing.
- Sugar prices continue to climb, and there could be a supply shortage shaping up soon.
Open positions
| Date | Position | Qty | Month/Yr | Contract | Entry Price | Last Price | Profit/Loss |
|---|---|---|---|---|---|---|---|
| 01/16/09 | Long | 1 | MAR 09 | Corn | 374 3/4 | 389 3/4 | $750.00 |
| 12/31/08 | Long | 1 | MAR 09 | Cotton | 48.52 | 48.84 | $160.00 |
| 01/13/09 | Long | 1 | MAR 09 | Mini Soybeans | 987 1/4 | 1020 | $327.50 |
| 01/13/09 | Long | 1 | MAR 09 | Mini Soybeans | 989 1/4 | 1020 | $307.50 |
| Net Profit/Loss On Open Positions | $1,545.00 | ||||||
Account Balances
| Current Cash Balance | $39,234.38 |
| Open Trade Equity | $1,545.00 |
| Total Equity | $40,779.38 |
| Long Option Value | $0.00 |
| Short Option Value | $0.00 |
| Net Liquidating Value | $40,779.38 |
———————————————
Cashed out: $20,000.00
Total value: $60,779.38
Weekly return: -16.0%
2009 YTD return: -19.7%
***”Cash out” mostly means taxes, living expenses, and startup capital for our time management software company that was recently covered by the Sacramento Business Journal and Inc magazine.


Recent Comments