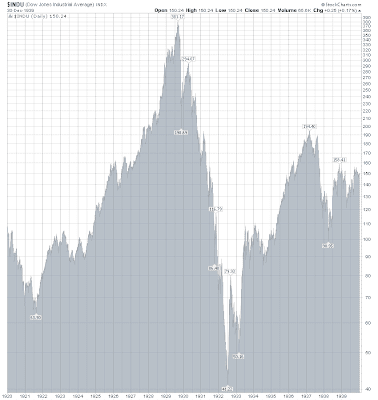
This epic stock market rally has done exactly what it was supposed to do – it’s retraced about half of the losses from the previous crash. It’s got folks feeling comfortable again – while maybe not outright enthusiastic about things, they now believe the carpet is not going to be pulled out from under them.
That’s exactly what buying stocks now is a more dangerous proposition than it has been anytime this year thus far.
So can big rallies, following big crashes, be sustained?
I did a little bit of digging through historical data, to see if there was a case where a severe crash was isolated – that is, it retraced back up, and there was nothing more to it. Typically, crashes occur in three legs down (five “waves” in total, counting two countertrend bounces) – at least this was my belief, which I wanted to double check.
I’m going to compare this market crash/rally with the crash/rally from 1929/1930, and only that, because I was not able to find another market crash, and subsequent rally, as severe as what we’ve experience over the past year or two (severe being 50%). I wish we had another example to look at, but I wasn’t able to find one since 1900 in the US that met this criteria!
The Great Depression’s first leg down, and the 2008-09 markets, are in rarified air that meets these stomach churning guidelines:
- A ~50% stock market drop
- Followed by a ~50% stock market rally
Astute traders and investors, no doubt of which our readers here are, know full well that 50% down, followed by 50% up, does not get you back to break even!
First, let’s take a look at the first leg down of the Great Depression, using the Dow Jones Industrial Average (DJIA) as our measuring stick.
Source: StockCharts.com
Date DJIA % Change # Days
09/03/1929 381.17
11/13/1929 198.69 -48% 71
04/17/1930 294.07 +48% 155
You have to love the symmetry of the 1930 rally! 48% down, then 48% up…before turning back down. Eventually the DJIA bottomed in 1932 at 41 – shedding an awesome 80% from the Dow’s 1929 high.
Now, let’s check out the newly minted Crash of 2008:
Source: StockCharts.com
Date DJIA % Change # Days
10/09/2007 14164
03/10/2009 6547 -54% 518
10/19/2009 10092 +54% 223
Oh the symmetry is fantastic! This time we retraced 54%, after giving up 54% initially – again roughly 50%.
Now, the million dollar question is: “Where to next?”
It’s hard to make an argument for stocks continuing their rally from here. They are expensive by all traditional valuation measures, the economic recovery is not robust (maybe even non-existent), and until proven otherwise, this rally has been nothing more than a standard retracement.
The stock market doesn’t just drop 50% for no good reason. Something more is usually amiss. Judging from the only recent historical analogy we have to use, caution is still the order of the day!


Recent Comments